File:Graid-performance.png
| Line 1: | Line 1: | ||
| + | Chart showing performance of graid3 and gmirror (and some proprietary RAID1 hardware implementations). | ||
| + | |||
| + | '''System: ''' | ||
| + | amd64 6.2-RELEASE, Athlon X2 5000+, 2GB RAM | ||
| + | 3x Western Digital 250GB drives (WDC WD2500JS-22NCB1 10.02E02 SATA-300) | ||
| + | 2x Western Digital 500GB drives (WDC WD5000AAKS-00YGA0 12.01C02) | ||
| + | Nvidia nForce onboard RAID controller, Promise TX2300 RAID controller | ||
| + | |||
| + | Each process shown in the graph is a cp to /dev/null of an individually generated 3200MB random binary file | ||
| + | (using dd if=/dev/random bs=16m count=200). | ||
| + | |||
| + | The "split" balance algorithm for gmirror was also tested but resulted in universally horrible performance, so was not included on the graph. | ||
| + | The "-r" option (use parity drive on reads) for graid3 was also tested but typically resulted in slight to severe performance decrease, so was not included on the graph. | ||
| + | |||
| + | Raw data follows: | ||
Graid3: 3x250/2x500 213 137 106 105 105 | Graid3: 3x250/2x500 213 137 106 105 105 | ||
| Line 14: | Line 29: | ||
Gmirror: 2x250 split 128k 55 47 47 47 48 | Gmirror: 2x250 split 128k 55 47 47 47 48 | ||
Gmirror: 3x250/2x500 split 128k 54 50 47 47 47 | Gmirror: 3x250/2x500 split 128k 54 50 47 47 47 | ||
| + | |||
| + | "Delta" in raw numbers refers to individual processes finishing significantly faster than others, though all were started simultaneously. | ||
Revision as of 22:07, 26 December 2007
Chart showing performance of graid3 and gmirror (and some proprietary RAID1 hardware implementations).
System:
   amd64 6.2-RELEASE, Athlon X2 5000+, 2GB RAM
   3x Western Digital 250GB drives (WDC WD2500JS-22NCB1 10.02E02 SATA-300)
   2x Western Digital 500GB drives (WDC WD5000AAKS-00YGA0 12.01C02)
   Nvidia nForce onboard RAID controller, Promise TX2300 RAID controller
Each process shown in the graph is a cp to /dev/null of an individually generated 3200MB random binary file (using dd if=/dev/random bs=16m count=200).
The "split" balance algorithm for gmirror was also tested but resulted in universally horrible performance, so was not included on the graph. The "-r" option (use parity drive on reads) for graid3 was also tested but typically resulted in slight to severe performance decrease, so was not included on the graph.
Raw data follows:
Graid3: 3x250/2x500			213	137	106	105	105
Graid3: 3x250/2x500 -r			187	144	103	105	107
Nvidia onboard RAID1: 2x250		60	108	90	96	100	* 15 secs delta on 2-process copy / 38 seconds on 5-process!
Graid3: 3x250 -r			116	88	79	76	75
Graid3: 3x250				115	98	77	76	75
Baseline: 1x500			76	70	72	72	72
Gmirror: 3x250/2x500 round-robin	63	73	69	71	72
Promise TX-2300 RAID1: 2x250		61	52	54	55	57	* 15 sec delta on 5-process copy
Gmirror: 3x250 round-robin		59	53	53	56	55
Gmirror: 2x250 round-robin		58	49	51	51	50
Baseline: 1x250			56	56	55	55	56
Gmirror: 3x250 split 128k		55	46	49	55	54
Gmirror: 2x250 split 128k		55	47	47	47	48
Gmirror: 3x250/2x500 split 128k	54	50	47	47	47
"Delta" in raw numbers refers to individual processes finishing significantly faster than others, though all were started simultaneously.
File history
Click on a date/time to view the file as it appeared at that time.
| Date/Time | Thumbnail | Dimensions | User | Comment | |
|---|---|---|---|---|---|
| current | 04:28, 29 December 2007 | 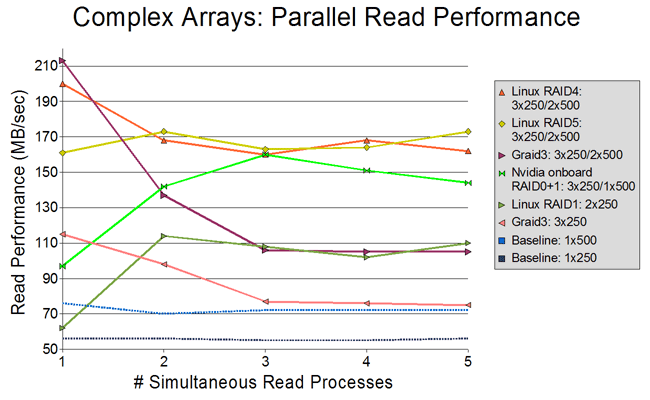 | 650 × 400 (25 KB) | Jimbo (Talk | contribs) | |
| 03:54, 29 December 2007 | No thumbnail | (25 KB) | Jimbo (Talk | contribs) | (add Linux RAID4 data) | |
| 02:13, 28 December 2007 | 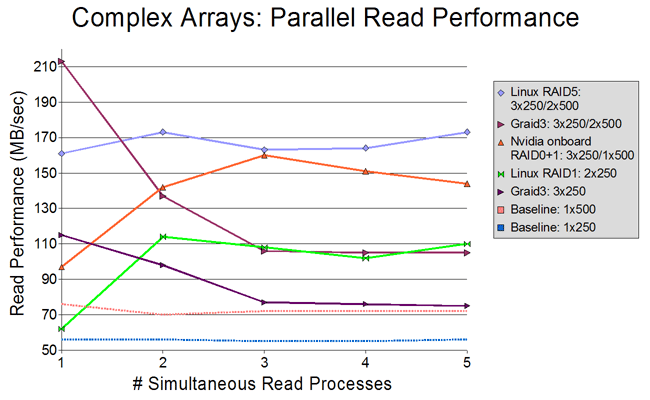 | 650 × 400 (22 KB) | Jimbo (Talk | contribs) | (Linux RAID5 data added) | |
| 00:30, 28 December 2007 | 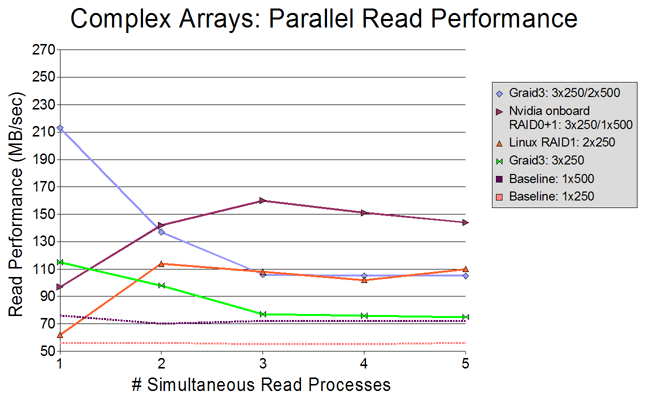 | 650 × 400 (21 KB) | Jimbo (Talk | contribs) | (added some linux and nvidia 0+1 data) | |
| 22:00, 26 December 2007 | 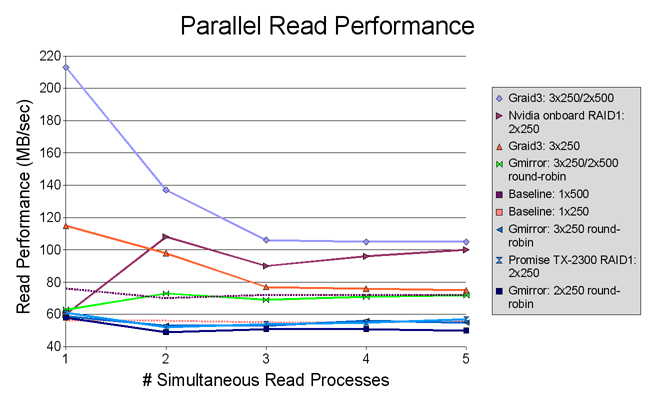 | 650 × 400 (22 KB) | Jimbo (Talk | contribs) |
- Edit this file using an external application (See the setup instructions for more information)
File usage
The following page links to this file: