File:Gmirror-performance.png
(Chart showing performance of gmirror (and some proprietary RAID1 hardware implementations) under amd64 6.2-RELEASE, Athlon X2 5000+, 2GB RAM. Each file copied in the graph was individually generated using dd if=/dev/random bs=16m count=200 (3200MB file).) |
(added Linux data) |
||
| (3 intermediate revisions by one user not shown) | |||
| Line 1: | Line 1: | ||
| − | Chart showing performance of gmirror (and some proprietary RAID1 hardware implementations) | + | Chart showing performance of gmirror (and some proprietary RAID1 hardware implementations). |
| + | |||
| + | '''System: ''' | ||
| + | FreeBSD OS: amd64 6.2-RELEASE | ||
| + | Linux OS: amd64 Ubuntu Server 7.04 | ||
| + | |||
| + | Athlon X2 5000+, 2GB RAM | ||
| + | 3x Western Digital 250GB drives (WDC WD2500JS-22NCB1 10.02E02 SATA-300) | ||
| + | 2x Western Digital 500GB drives (WDC WD5000AAKS-00YGA0 12.01C02) | ||
| + | Nvidia nForce onboard RAID controller | ||
| + | Promise TX2300 RAID controller | ||
| + | |||
| + | Each process shown in the graph is a cp to /dev/null of an individually generated 3200MB random binary file | ||
| + | (using dd if=/dev/random bs=16m count=200). | ||
| + | |||
| + | The "split" balance algorithm was also tested but resolved in universally horrible performance, so was not included on the graph. | ||
| + | |||
| + | For these tests, FreeBSD's read-ahead cache value was GREATLY increased from 6.2-RELEASE's default of 8: '''sysctl -w vfs.read_max=128'''. Similarly, Ubuntu's read-ahead cache value was drastically increased from system default of '''hdparm /dev/md0 -a256''' to '''hdparm /dev/md0 -a4096'''. Changing these values made TREMENDOUS differences in throughput - frequently doubling, sometimes even quintupling average transfer rate across tests. | ||
| + | |||
| + | Raw data follows: | ||
| + | |||
| + | Linux RAID1: 3x250/2x500 68 152 213 251 258 * Hdparm -a 4096 | ||
| + | Linux RAID1: 3x250 62 123 155 158 162 * Hdparm -a 4096 | ||
| + | Linux RAID1: 2x250 62 114 108 102 110 * Hdparm -a 4096 31s delta on 4-copy... 30-sec delta on 5-copy | ||
| + | Nvidia onboard RAID1: 2x250 60 108 90 96 100 * 15 secs delta on 2-process copy / 38 seconds on 5-process copy | ||
| + | Gmirror: 3x250/2x500 round-robin 63 73 69 71 72 | ||
| + | Baseline: 1x500 76 70 72 72 72 | ||
| + | Baseline: 1x250 56 56 55 55 56 | ||
| + | Gmirror: 3x250 round-robin 59 53 53 56 55 | ||
| + | Promise TX-2300 RAID1: 2x250 61 52 54 55 57 * 15 sec delta on 5-process copy | ||
| + | Gmirror: 3x250/2x500 split 128k 54 50 47 47 47 | ||
| + | Gmirror: 2x250 round-robin 58 49 51 51 50 | ||
| + | Gmirror: 2x250 split 128k 55 47 47 47 48 | ||
| + | Gmirror: 3x250 split 128k 55 46 49 55 54 | ||
| + | |||
| + | "Delta" in raw numbers refers to individual processes finishing significantly faster than others, though all were started simultaneously. | ||
Latest revision as of 22:45, 27 December 2007
Chart showing performance of gmirror (and some proprietary RAID1 hardware implementations).
System:
   FreeBSD OS: amd64 6.2-RELEASE
     Linux OS: amd64 Ubuntu Server 7.04

   Athlon X2 5000+, 2GB RAM
   3x Western Digital 250GB drives (WDC WD2500JS-22NCB1 10.02E02 SATA-300)
   2x Western Digital 500GB drives (WDC WD5000AAKS-00YGA0 12.01C02)
   Nvidia nForce onboard RAID controller
   Promise TX2300 RAID controller
Each process shown in the graph is a cp to /dev/null of an individually generated 3200MB random binary file (using dd if=/dev/random bs=16m count=200).
The "split" balance algorithm was also tested but resolved in universally horrible performance, so was not included on the graph.
For these tests, FreeBSD's read-ahead cache value was GREATLY increased from 6.2-RELEASE's default of 8: sysctl -w vfs.read_max=128. Similarly, Ubuntu's read-ahead cache value was drastically increased from system default of hdparm /dev/md0 -a256 to hdparm /dev/md0 -a4096. Changing these values made TREMENDOUS differences in throughput - frequently doubling, sometimes even quintupling average transfer rate across tests.
Raw data follows:
Linux RAID1: 3x250/2x500		68	152	213	251	258	* Hdparm -a 4096
Linux RAID1: 3x250			62	123	155	158	162	* Hdparm -a 4096
Linux RAID1: 2x250			62	114	108	102	110	* Hdparm -a 4096 31s delta on 4-copy... 30-sec delta on 5-copy
Nvidia onboard RAID1: 2x250		60	108	90	96	100	* 15 secs delta on 2-process copy / 38 seconds on 5-process copy
Gmirror: 3x250/2x500 round-robin	63	73	69	71	72
Baseline: 1x500			76	70	72	72	72
Baseline: 1x250			56	56	55	55	56
Gmirror: 3x250 round-robin		59	53	53	56	55
Promise TX-2300 RAID1: 2x250		61	52	54	55	57	* 15 sec delta on 5-process copy
Gmirror: 3x250/2x500 split 128k	54	50	47	47	47
Gmirror: 2x250 round-robin		58	49	51	51	50
Gmirror: 2x250 split 128k		55	47	47	47	48
Gmirror: 3x250 split 128k		55	46	49	55	54
"Delta" in raw numbers refers to individual processes finishing significantly faster than others, though all were started simultaneously.
File history
Click on a date/time to view the file as it appeared at that time.
| Date/Time | Thumbnail | Dimensions | User | Comment | |
|---|---|---|---|---|---|
| current | 00:25, 28 December 2007 |  | 650 × 400 (23 KB) | Jimbo (Talk | contribs) | |
| 00:13, 28 December 2007 | 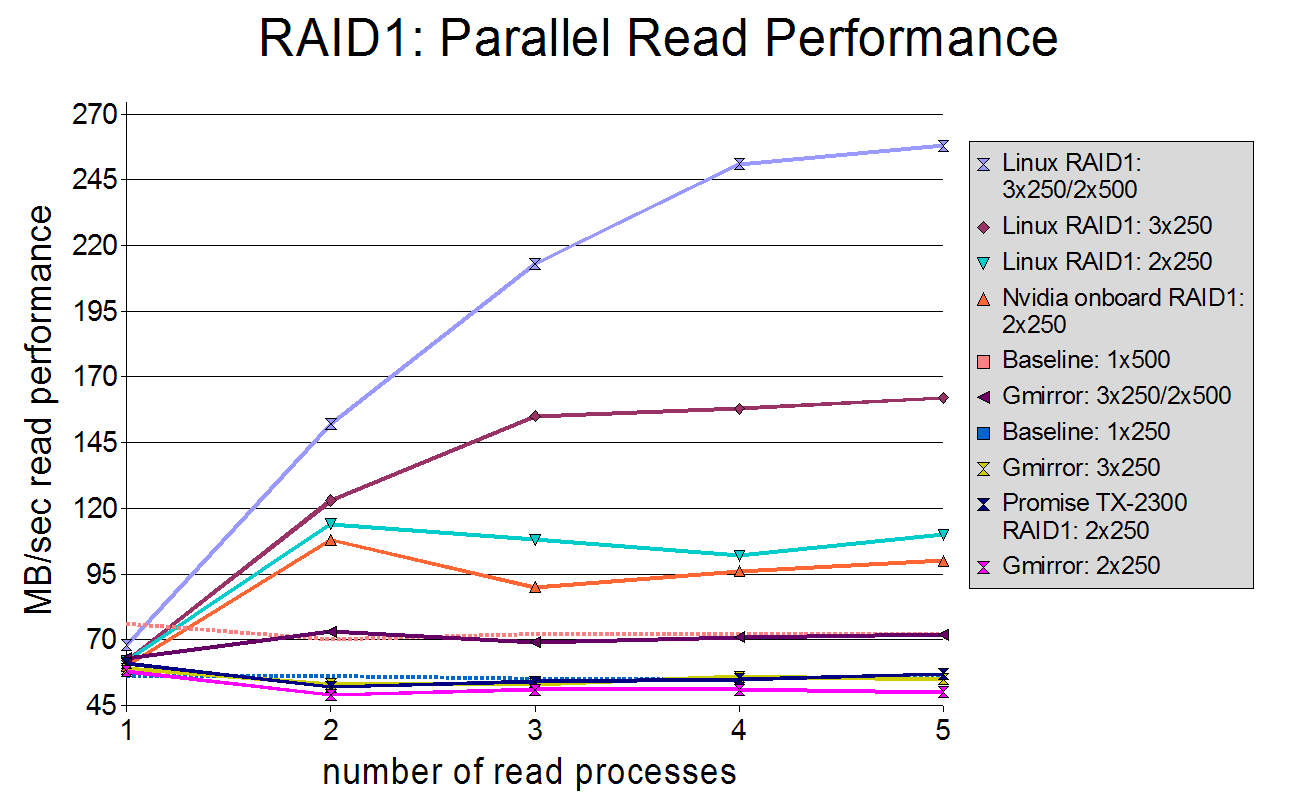 | 1,300 × 800 (25 KB) | Jimbo (Talk | contribs) | ||
| 22:38, 27 December 2007 | 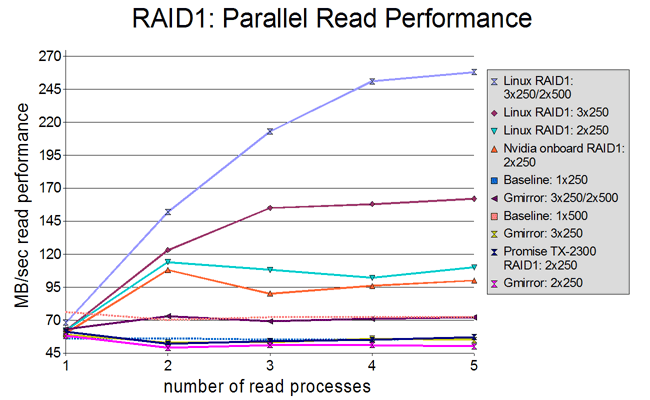 | 650 × 400 (23 KB) | Jimbo (Talk | contribs) | (added Linux RAID1 data) | |
| 21:50, 26 December 2007 | 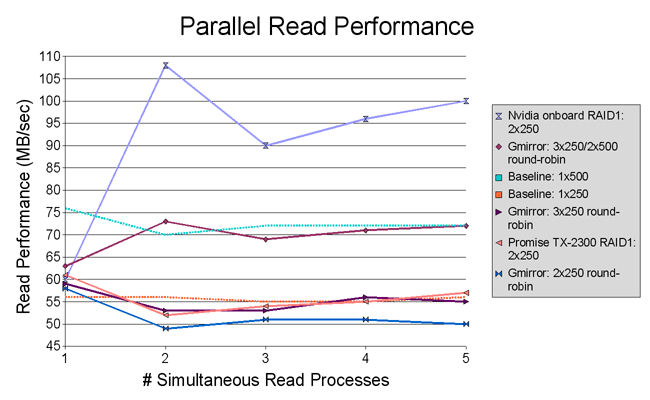 | 650 × 400 (22 KB) | Jimbo (Talk | contribs) | ((oops - wrong file uploaded first time)) | |
| 21:48, 26 December 2007 | 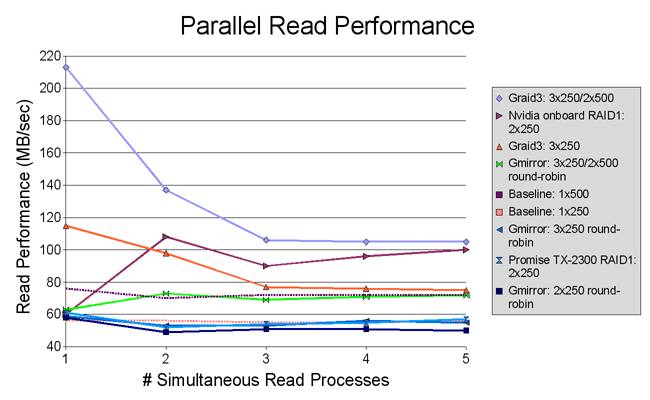 | 650 × 400 (22 KB) | Jimbo (Talk | contribs) | (Chart showing performance of gmirror (and some proprietary RAID1 hardware implementations) under amd64 6.2-RELEASE, Athlon X2 5000+, 2GB RAM. Each file copied in the graph was individually generated using dd if=/dev/random bs=16m count=200 (3200MB file).) |
- Edit this file using an external application (See the setup instructions for more information)
File usage
The following page links to this file: